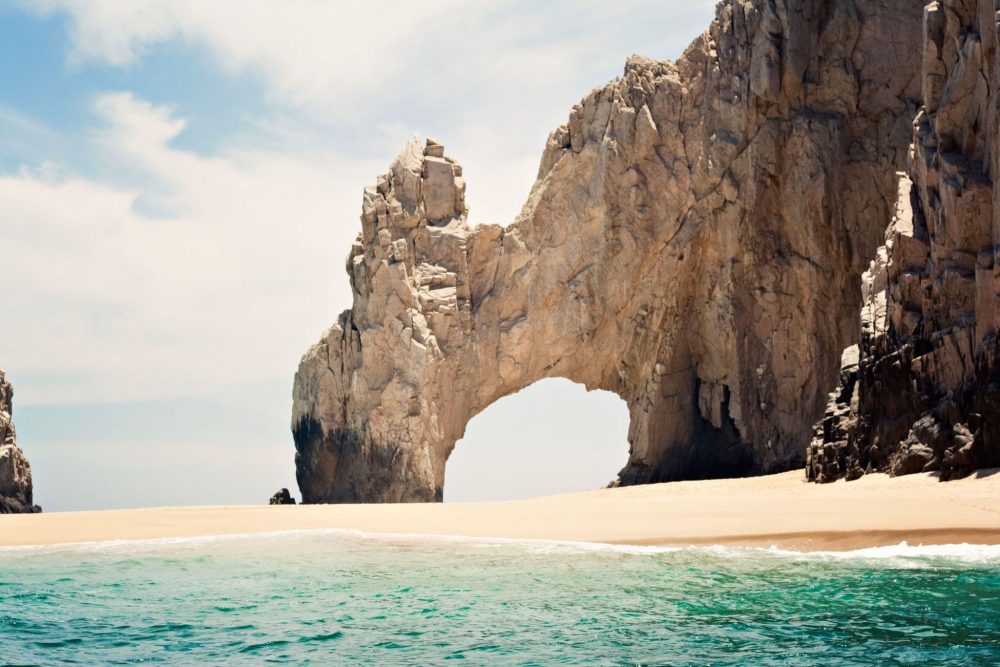
Cabo Weather
Cabo weather reaches its peak warmth in July, which is the hottest month, with an average temperature of 31°C (87°F), while January is the coolest, averaging 19°C (66°F). The sunniest time of the year is in June, boasting an average of 12 daily sunshine hours.
June also stands out as the wettest month, receiving an average rainfall of almost 110mm. August is ideal for those looking to enjoy the sea, as the temperature averages a warm 29°C (83°F).
Jump to a specific month
Cabo Weather in January
| Month | Avg. High Temp | Avg. Low Temp | Sea Temp |
|---|---|---|---|
| January | 26°C/79°F | 12°C/54°F | 24°C/75°F |
January in Cabo San Lucas is the coolest month, yet it remains pleasantly warm.
Daily Temperatures
Average temperatures range from a low of 12°C (54°F) to a high of 26°C (79°F), with an overall average of 19°C (66°F).
Sea Temperatures
The sea temperature averages 24°C (75°F), slightly cooler for activities like swimming and snorkeling.
Sunshine and Light
This month experiences some of the year’s lowest sunshine levels, averaging 10 hours per day, but still promises plenty of sunny days.
Rainfall
January is the driest month, with an average of only 3mm of rain over 27 days, ensuring a high likelihood of clear skies. The humidity is relatively high at 83%, but not uncomfortable.
Being outside the hurricane season, January is free from extreme weather conditions, making it an ideal time for visitors seeking a cooler but sunny climate.
See the link for more detailed insights and exploration of Cabo’s weather in January.
Cabo Weather in February

| Month | Avg. High Temp | Avg. Low Temp | Sea Temp |
|---|---|---|---|
| February | 30°C/86°F | 13°C/55°F | 23°C/73°F |
February in Cabo San Lucas is among the cooler months, yet it remains warm.
Daily Temperatures
Daily temperatures average between a high of 30°C (86°F) and a low of 13°C (55°F), with an overall average of 21°C (70°F).
Sea Temperatures
The sea temperature, averaging 23°C (73°F), is cooler, making a wetsuit advisable for water activities like snorkeling or surfing.
Sunshine and Light
The month enjoys 11 hours of sunshine daily, shy of the yearly peak.
Rainfall
Rainfall is minimal in February, with an average of 7mm over 26 days, ensuring primarily dry conditions.
See the link for more detailed insights into Cabo’s weather in February.
Cabo Weather in March
| Month | Avg. High Temp | Avg. Low Temp | Sea Temp |
|---|---|---|---|
| March | 30°C/86°F | 13°C/55°F | 23°C/73°F |
Daily Temperatures
March in Cabo San Lucas continues with cooler yet agreeable weather trends. The month sees average daily highs of around 30°C (86°F) and lows of 13°C (55°F), culminating in an average temperature of about 21°C (70°F).
Compared to other Pacific locations, these conditions are milder than Hawaii but warmer than northern areas like Los Angeles.
Sea Temperatures
The sea temperature, at an average of 23°C (73°F), is among the coolest of the year, making activities such as snorkeling or surfing more comfortable with a wetsuit.
Extreme Weather
As March is outside the typical storm season, which runs from June to October, the likelihood of experiencing extreme weather is low.
See the link for a deeper view of Cabo’s March weather specifics.
Cabo Weather in April

| Month | Avg. High Temp | Avg. Low Temp | Sea Temp |
|---|---|---|---|
| April | 33°C/92°F | 15°C/59°F | 23°C/73°F |
Daily Temperatures
April in Cabo San Lucas marks a noticeable shift towards warmer weather. The month experiences average daily highs of 33°C (92°F) and lows of 15°C (59°F), with an overall average temperature of 24°C (75°F).
Sea Temperatures
The sea temperature remains comfortable at an average of 23°C (73°F), ideal for various water activities.
Sunshine and Light
Sunshine is abundant in April, boasting some of the year’s highest levels at an average of 12 hours daily. This is a significant increase from the 10-hour average in January.
Rainfall and Humidity
Rainfall is minimal, with April seeing an average of just 4mm over 26 days, making it one of the driest months, in stark contrast to the heavier rains of June.
Humidity in April is moderate, averaging 75%, comparable to the levels experienced in October.
Wind Speed and Extreme Weather
Wind speeds in April start to pick up, averaging low speeds around 4-5 m/s, as a precursor to the summer storm season. April remains firmly outside the hurricane season, which runs from June to October, minimizing the likelihood of extreme weather conditions.
See the link for more detailed insights into Cabo’s weather in April.
Cabo weather in May
| Month | Avg. High Temp | Avg. Low Temp | Sea Temp |
|---|---|---|---|
| May | 35°C/96°F | 17°C/62°F | 24°C/74°F |
Daily Temperatures
May in Cabo San Lucas ushers in the early signs of summer heat. The month sees daily average temperatures ranging from a high of 35°C (96°F) to a low of 17°C (62°F), with an overall average of 26°C (79°F).
Sea Temperatures
Despite the rising air temperatures, the sea remains relatively cool, with an average temperature of 24°C (74°F).
Sunshine and Light
Sunshine is abundant in May, tying with the sunniest months of the year at 12 hours per day, a notable increase from the 9 hours experienced in September.
Rainfall and Humidity
Rainfall begins to pick up slightly, with an average of 8mm over 27 days, indicating a gradual approach towards the rainier season.
Humidity in May slightly increases to an average of 79%, higher than in April but still below the December peak of 85%.
Wind Speed and Extreme Weather
Wind conditions in May are steady and moderate, with speeds ranging from 1 – 4.5 m/s.
While there is a minor increase in precipitation compared to April, May remains outside the typical storm season, which runs from June to October. Thus, extreme weather conditions are unlikely.
See the link for a more detailed exploration of Cabo’s weather in May.
Cabo weather in June
| Month | Avg. High Temp | Avg. Low Temp | Sea Temp |
|---|---|---|---|
| June | 37°C/99°F | 21°C/69°F | 24°C/76°F |
Daily Temperatures
June in Cabo San Lucas marks the peak of the summer heat, sharing the title of the hottest month with July. Average daily temperatures range from a high of 37°C (99°F) to a low of 21°C (69°F), with an overall average of 29°C (84°F).
Sea Temperatures
The sea temperature averages a pleasant 24°C (76°F).
Sunshine and Light
Despite the onset of the rainy season, June still boasts the year’s highest levels of sunshine, averaging 12 hours per day, on par with May.
Rainfall and Humidity
That said, rainfall significantly increased, jumping from May’s 8mm to 107mm over 27 days in June, marking the start of the wetter period in Cabo San Lucas.
The humidity in June is moderate at 75%, lower than the December peak of 85%.
Wind Speed and Extreme Weather
While June marks the beginning of the hurricane season, which lasts until October, early June typically does not experience severe storms, making extreme weather unlikely.
See the link for more detailed insights into Cabo’s weather in June.
Cabo weather in July
| Month | Avg. High Temp | Avg. Low Temp | Sea Temp |
|---|---|---|---|
| July | 37°C/99°F | 24°C/74°F | 27°C/80°F |
Daily Temperatures
July in Cabo San Lucas ties with June as the hottest month of the year. The daily average temperatures range from a high of 37°C (99°F) to a low of 24°C (74°F), with an overall average of 30°C (87°F).
Sea Temperatures
The sea temperature is warm and inviting at an average of 27°C (80°F), just slightly cooler than the August peak.
Sunshine and Light
Sunshine hours in July decreased to an average of 10 hours per day, a reduction from the 12-hour highs of June.
Rainfall and Humidity
Rainfall significantly increases, making July one of the wettest months in Cabo San Lucas, with an average of 107mm over 27 days, starkly contrasting to the minimal rainfall in January. Humidity in July is relatively high but still comfortable at 74%.
Wind Speed and Extreme Weather
Wind conditions remain moderate throughout July. While July falls within the hurricane season, which lasts from June to October, the likelihood of storms hitting the region increases from August to October, with September being the peak risk month.
See the link for a more detailed exploration of Cabo’s weather in July.
Cabo weather in August
| Month | Avg. High Temp | Avg. Low Temp | Sea Temp |
|---|---|---|---|
| August | 37°C/98°F | 24°C/74°F | 28°C/83°F |
Daily Temperatures
August in Cabo San Lucas continues to be one of the hottest months of the year. The daily average temperatures hover around a high of 37°C (98°F) and a low of 24°C (74°F), with an overall average of 30°C (86°F).
Sea Temperatures
The sea temperature peaks at 28°C (83°F), making it the warmest and most ideal time for snorkeling and swimming.
Sunshine and Light
Sunshine in August is moderate, averaging 10 hours daily, slightly less than the 12-hour highs experienced in September and October.
Rainfall and Humidity
Rainfall in August is moderate, marking a middle ground between the dryness of January and the peak rains of June. Humidity in August is relatively high but still comfortable at 73%.
Wind Speed and Extreme Weather
Wind conditions in August are moderate. August is within the hurricane season, which runs from June to October. While September is the peak month for powerful storms, followed by October, August ranks third in storm activity, with strong winds and coastal flooding potential.
See the link for more detailed insights into Cabo’s weather in August.
Cabo weather in September

| Month | Avg. High Temp | Avg. Low Temp | Sea Temp |
|---|---|---|---|
| September | 36°C/97°F | 23°C/74°F | 28°C/82°F |
Daily Temperatures
September in Cabo San Lucas presents a blend of warm temperatures and moderate sunshine. The daily average temperatures range from a high of 36°C (97°F) to a low of 23°C (74°F), with an overall average of 30°C (85°F).
Sea Temperatures
The sea temperature remains warm at an average of 28°C (82°F), ideal for swimming and snorkeling.
Sunshine and Light
Sunshine during September is moderate, averaging 9 hours per day. This month falls within the storm season, but rainfall is generally moderate.
Rainfall and Humidity
Humidity in September is slightly higher at 77%, reflecting the transitional nature of the season.
Wind Speed and Extreme Weather
Wind conditions in September are moderate. September is the peak of the hurricane season in the region, and it is the month most likely to experience powerful storms, which can bring strong winds and coastal flooding.
See the link for more detailed insights into Cabo’s weather in September.
Cabo weather in October
| Month | Avg. High Temp | Avg. Low Temp | Sea Temp |
|---|---|---|---|
| October | 35°C/95°F | 21°C/70°F | 27°C/81°F |
Daily Temperatures
October in Cabo San Lucas offers pleasant temperatures and moderate sunshine. The daily average temperatures range from a high of 35°C (95°F) to a low of 21°C (70°F), with an overall average of 28°C (82°F).
Sea Temperatures
The sea temperature remains warm at an average of 27°C (81°F), perfect for swimming and snorkeling.
Sunshine and Light
Sunshine during October is moderate, averaging 10 hours per day. This is a decrease from the 12-hour highs of June but still ample for enjoying outdoor activities.
Rainfall and Humidity
Rainfall in October is relatively low, marking the end of the Pacific storm season. The month averages 26 rainy days but minimal overall rainfall of 45mm. Humidity in October drops to an average of 76%, indicating the onset of the drier season.
Wind Speed and Extreme Weather
Wind conditions in October are moderate. While October is technically within the hurricane season, which lasts from June to October, the likelihood of extreme weather is low, especially compared to the peak storm month of September.
See the link for more detailed insights into Cabo’s weather in October.
Cabo weather in November
| Month | Avg. High Temp | Avg. Low Temp | Sea Temp |
|---|---|---|---|
| November | 32°C/90°F | 16°C/61°F | 27°C/81°F |
Daily Temperatures
November in Cabo San Lucas marks the transition from summer to milder temperatures. The daily average temperatures are quite comfortable, with a high of 32°C (90°F) and a low of 16°C (61°F), averaging out at 24°C (75°F).
Sea Temperatures
The sea temperature remains inviting for water activities at an average of 27°C (81°F), making it one of the best times for watersports.
Sunshine and Light
Sunshine in November is moderate, averaging 10 hours per day. This decreases from the 12-hour highs experienced from April to June but provides ample daylight for outdoor activities.
Rainfall and Humidity
Rainfall in November is minimal, signaling the end of the storm season. Humidity in November is moderate at 83%, offering a comfortable climate for visitors.
Wind Speed and Extreme Weather
While November is technically within the Pacific hurricane season, which runs until the end of the month, the likelihood of storms hitting Cabo San Lucas is low, especially compared to earlier months.
See the link for more detailed insights into Cabo’s weather in November.
Cabo weather in December
| Month | Avg. High Temp | Avg. Low Temp | Sea Temp |
|---|---|---|---|
| December | 28°C/82°F | 13°C/55°F | 25°C/77°F |
Daily Temperatures
December in Cabo San Lucas brings some of the coolest yet most comfortable temperatures of the year, with daily averages ranging from 13°C (55°F) at night to 28°C (82°F) during the day.
Sea Temperatures
The sea remains pleasantly warm, averaging 25°C (77°F).
Sunshine and Light
The month is characterized by lower sunshine hours, similar to September, and minimal rainfall, making it one of the driest periods.
Rainfall and Humidity
Humidity is relatively high at around 85%, and winds are moderate.
Wind Speed and Extreme Weather
Notably, December falls outside the storm season, offering stable and enjoyable weather conditions.
See the link for more detailed insights into Cabo’s weather in December.